
Capacity needs a material and a quality rule
A screen opening does not define a machine’s useful output on its own. Ask what material enters, which fraction counts as accepted product, how quality is measured and under which feed and operating conditions. Otherwise a “kg/h” figure may describe feed entering the machine rather than product meeting the specification.
This article combines an engineering method, a clearly assumed calculation and limited literature context. It contains no Zhenwei factory trial dataset and makes no rated-capacity or efficiency guarantee.
ILLUSTRATIVE CALCULATION · NOT A TRIAL RESULT
Separate feed rate from accepted-product output
Use measured masses and elapsed time from a defined trial. The defaults below are assumed numbers for learning the calculation; they are not Zhenwei machine performance.
Accepted-product yield is not grade compliance, classification efficiency or recovery of a measured feed fraction. An unaccounted mass may include samples or material retained in the equipment; investigate it rather than labelling it product loss automatically. Inputs remain in this browser only.
Keep the streams and the clock visible
Identify feed, accepted product, collected oversize or other grades, and any retained or unaccounted material. Give every collection point a clear label. Define the start and end of the measured interval, including whether it is a stable segment or a complete run with transitions.
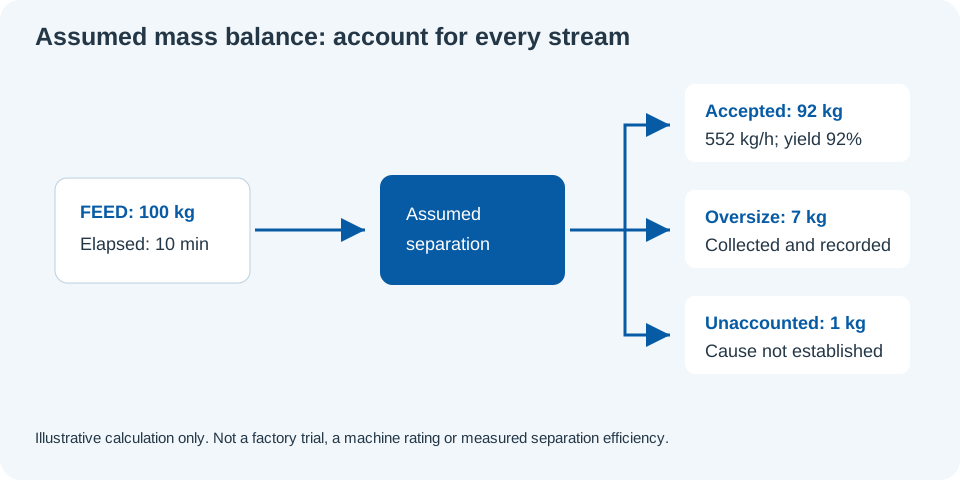
The diagram and calculator use an assumed example to explain the records needed. The numbers are not measurements from the photographed equipment, a customer installation or either paper cited below.
Three quantities that should not be confused
Feed throughput describes the incoming mass over time. Accepted-product output describes only the mass satisfying the chosen product rule over time. Accepted/feed yield is a mass ratio; it does not prove that every desired particle was recovered or that unwanted particles were removed.
For separation efficiency, recovery or contamination, state the relevant particle classes and analysis method. Do not assign one of those labels to a passing-mass percentage just because it is easy to calculate.
| Quantity | Definition | Limitation |
|---|---|---|
| Feed throughput | Feed mass / elapsed time | Says nothing by itself about product quality |
| Accepted-product output | Accepted stream mass / elapsed time | Requires a defined quality rule for that stream |
| Accepted/feed yield | Accepted mass / feed mass | Not the recovery of a particular particle class |
| Mass-balance discrepancy | Feed minus all recorded output masses | May include retained material and measurement/sampling effects |
A transparent example, not a test result
Assume 100 kg of feed is processed during a measured 10-minute interval, with 92 kg collected as accepted product and 7 kg as oversize. The feed rate is 600 kg/h. The accepted-stream rate is 552 kg/h, and accepted/feed yield is 92%. One kilogram is not accounted for by those two collections.
That missing kilogram must remain visible. It might relate to retained material, collection boundaries or measurement uncertainty, but the example does not establish the cause. Nor does 92% establish separation efficiency without composition measurements of feed and products. Changing the assumed values in the calculator changes an illustration, not a machine rating.
Describe the feed before testing equipment
Record particle-size distribution, moisture condition, bulk density, temperature, agglomerates and relevant safety properties for a representative batch. Identify where the sample was taken and how it represents the process stream. Record the target aperture with its construction and units, the screen configuration and actual feed behaviour.
A batch with a different fraction near the opening can present a different separation task even when the material name and nominal aperture are unchanged. Avoid extrapolating from a convenient dry sample to a variable production feed without explaining the gap.
Change one question at a time where practical
For a feeding study, keep machine, mesh, material and quality rule fixed while defining permitted feed conditions. For an ultrasonic on/off question, keep the compatible assembly and material consistent. For a moisture or size-distribution question, identify the intended variable and measure it.
An engineer should choose the safe range, repeat plan and order of runs. Record stabilisation, interruptions, setting changes and unfavourable results. Do not select only the highest short-duration rate or imply statistical certainty from a repetition count chosen without considering variability.
What the cited research can support
Wu and colleagues’ 2018 paper concerns vibration-parameter optimisation of a linear vibrating banana screen using DEM simulation. The verified reading scope here is the publisher abstract/method overview and bibliographic record, not a complete reanalysis of its dataset. It supports treating operating parameters and the simulated system as part of the problem; simulation is not a Zhenwei plant test.
The 2025 Scientific Reports paper titled “Effect of particle size distribution on screening efficiency of vibrating screen” addresses the feed distribution question. The available review covers the abstract, methods and selected results, not a full numerical audit of every table or supplement. No value, optimum or improvement percentage from either paper is transferred to a Zhenwei product.
Wu et al. (2018): DEM study of a linear vibrating banana screen ↗
Scientific Reports (2025): particle-size distribution and screening efficiency ↗
Build a report that can support an equipment decision
Include the material batch and analysis method, model and screen, settings and actual feeding, timing boundaries, all collected masses, composition results, interruptions and limitations. Link each graph to its run IDs and original records. If repetitions or uncertainty are missing, say so.
The next decision might be to accept a configuration within stated conditions, test a narrower question or obtain a better representative sample. A trial report is useful because it makes that decision traceable—not because it produces a large-looking headline number.